Why Signal Mapping Matters Before You Install
A LoRaWAN deployment fails most often not because of the sensors — but because the gateway placement was guessed rather than measured. Signal mapping gives you real RSSI and SNR values at every point in a building before a single sensor is permanently installed, eliminating the risk of dead zones and post-installation rework.
What Is LoRaWAN Signal Mapping?
Signal mapping (also called a site survey or coverage walk) is the process of moving a LoRaWAN field tester through the space you intend to deploy sensors in, recording signal quality at each position. Sensor-Online plots those measurements on a floor plan or map, giving you a visual coverage picture.
The key metrics collected during a signal mapping walk are:
- RSSI (Received Signal Strength Indicator) — the raw signal power in dBm. A value above −90 dBm is considered good indoors.
- SNR (Signal-to-Noise Ratio) — how cleanly the signal is received above the noise floor. Values above −5 dB indicate reliable communication.
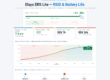
- Spreading Factor (SF) — lower SF means faster data rate and shorter airtime; a gateway far away or with poor signal will push devices to higher SF, increasing battery drain.
- Dominant gateway — which gateway is handling each measurement point, helping you identify coverage overlap and gaps.
How to Perform a Signal Mapping Walk
The process is straightforward and requires only a LoRaWAN field tester (such as the Glamos Walker or equivalent) and access to Sensor-Online:
- Register the field tester as a device in Sensor-Online.
- Walk slowly through the building with the tester, covering every room, corridor, stairwell and basement level.
- Sensor-Online records RSSI, SNR, SF and active gateway for each uplink, timestamped and geotagged if GPS is available.
- Review the coverage map in Sensor-Online to identify weak zones (RSSI below −110 dBm) and plan corrective gateway placement.
- Repeat the walk after any gateway adjustment to verify improvement.
Signal Behaviour in Different Building Materials
Signal attenuation varies significantly depending on what the radio waves have to pass through. Understanding this helps you predict coverage before the walk:
- Concrete and reinforced concrete — 15–25 dB attenuation per wall. The most challenging material in older Swedish apartment buildings.
- Brick — 10–15 dB per wall. Common in industrial buildings.
- Wood stud walls (plasterboard) — 3–6 dB per wall. Much more forgiving for LoRaWAN.
- Metal structures and foil insulation — can cause near-complete signal blocking. Requires careful gateway positioning or repeaters.
- Basement levels — typically require a dedicated indoor gateway or a cable-fed remote antenna.
Visualising Signal Maps in Sensor-Online
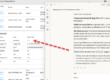
Sensor-Online supports overlaying signal measurement data on floor plans and outdoor maps. You can import a building drawing as a background image on the map widget and plot RSSI values as a colour-coded heatmap. This makes it immediately clear to facility managers and installers where coverage is strong (green), marginal (yellow) or insufficient (red).
The same visualisation can be exported as a PDF or screenshot for project documentation, handover reports or as evidence for a customer that the deployment is correctly engineered.
When to Repeat a Signal Map
Signal conditions in buildings change over time. A signal map done before installation may need updating after:
- Renovation works that add new walls or metal partitions
- New equipment installed near sensors (motors, frequency converters, refrigeration units)
- A gateway is moved, replaced or added
- Sensors are added in new areas not covered by the original walk
For large deployments, an annual coverage audit using Sensor-Online’s historical signal data is an efficient way to catch degradation before it causes missed readings.
FAQ: LoRaWAN Signal Mapping
How long does a signal mapping walk take?
For a typical Swedish apartment building of 1,000–3,000 m², expect one to three hours for a thorough walk including all floors. A large industrial site may take a full day.
Can I do signal mapping without a dedicated field tester?
You can use any LoRaWAN device and read RSSI/SNR from Sensor-Online, but a dedicated field tester with GPS logging gives much more accurate location-correlated data and speeds up the process significantly.
What RSSI threshold should I plan for?
For sensors that transmit every 10–15 minutes with typical payloads, RSSI values of −100 dBm or better at SF9 or below give a reliable link margin for production use. Values between −100 and −115 dBm are marginal and should be treated as coverage boundary zones.
Does Sensor-Online support 3D signal mapping across multiple floors?
Yes. You can upload separate floor plan images for each level and plot signal measurements per floor. This gives you a complete picture of gateway coverage vertically through a multi-storey building.
Want to plan a LoRaWAN deployment correctly from day one? Explore Sensor-Online’s platform or read more in the knowledge base.