What Is RSSI and Why Does It Matter?
RSSI stands for Received Signal Strength Indicator. It is measured in dBm (decibels relative to 1 milliwatt) and tells you how strongly a sensor’s radio signal is being received at the LoRaWAN gateway. The scale is negative — the closer to zero, the stronger the signal.
| RSSI Range | Signal Quality | LoRa Spreading Factor | What It Means |
| -40 to -70 dBm | Good | SF7 | Sensor is close or has clear line-of-sight to gateway |
| -71 to -90 dBm | Acceptable | SF9-10 | Walls, floors or distance are attenuating the signal |
| -91 to -120 dBm | Critical | SF11-12 | Sensor is struggling — retransmissions likely |
| KEY | RSSI does not just affect data reliability — it directly controls how much energy each transmission uses, which determines battery life. |
2. LoRaWAN Adaptive Data Rate (ADR)
LoRaWAN uses a mechanism called Adaptive Data Rate (ADR). The network server continuously monitors signal quality and instructs each sensor to use the most efficient radio settings for its environment.
How ADR Works
- Good signal (RSSI > -70 dBm) → network assigns SF7 (fastest, lowest energy)
- Medium signal (-70 to -90 dBm) → network steps up to SF9 or SF10
- Poor signal (< -90 dBm) → network assigns SF11 or SF12 (slowest, highest energy)
- Very poor signal → sensor may retransmit the same packet 2-3 times per cycle
The Energy Cost of Higher Spreading Factors
Each step up in Spreading Factor roughly doubles the time-on-air of each packet. Since radio transmission is by far the largest energy drain on a battery-powered sensor, this has a compounding effect on battery life.
| Spreading Factor | Time on Air (approx.) | Energy vs SF7 | Relative Battery Impact |
| SF7 | ~56 ms | 1× | Baseline |
| SF8 | ~103 ms | 2× | +100% |
| SF9 | ~185 ms | 3.3× | +230% |
| SF10 | ~370 ms | 6.6× | +560% |
| SF11 | ~741 ms | 13× | +1,200% |
| SF12 | ~1,483 ms | 26× | +2,500% |
3. Elsys ERS Lite — Battery Specifications
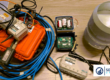
The Elsys ERS Lite is a compact indoor environment sensor using a single AA Lithium 3.6V battery (Saft LS14500 or equivalent, ~2,400 mAh).
Energy Budget Breakdown
| Operating Mode | Current Draw | Duration | Notes |
| Deep sleep | ~5 µA | ~14.9 min/cycle | Between transmissions |
| MCU wake + measure | ~2 mA | ~200 ms/cycle | Sensor reading |
| LoRa TX (SF7) | ~40 mA | ~56 ms | Best-case signal |
| LoRa TX (SF9) | ~40 mA | ~185 ms | Typical indoor |
| LoRa TX (SF12) | ~40 mA | ~1,483 ms | Worst-case signal |
At SF7 with 15-minute intervals the sensor spends over 99.9% of its time in deep sleep. As the Spreading Factor increases, the active radio time per day grows significantly, accelerating battery depletion.
4. Battery Life Calculation
Step 1 — Transmissions per day
| 96 transmissions/day = (24 hours × 60 min) / 15 min interval |
Step 2 — Energy per transmission (SF9 example)
Each transmission consists of: sleep current between cycles + sensor measurement + LoRa radio burst.
| E_tx = (40 mA × 185 ms) + (2 mA × 200 ms) + (0.005 mA × 900 s) ≈ 12.9 mAh/day |
At SF7 (RSSI > -70 dBm): E_tx ≈ 7.2 mAh/day → battery life ≈ ~6.5 years
At SF9 (RSSI ≈ -80 dBm): E_tx ≈ 12.9 mAh/day → battery life ≈ ~4.0 years
At SF12 (RSSI < -100 dBm): E_tx ≈ 30+ mAh/day → battery life ≈ ~1.1 years
Step 3 — Battery life formula
| Battery Life (years) = Battery Capacity (mAh) / (Daily Consumption (mAh/day) × 365) |
Reference Battery Life Table
| RSSI (dBm) | ADR Setting | Est. Battery Life | Swaps / Year (1,000 sensors) |
| -40 | SF7 | 7.5 years | 133 |
| -60 | SF7 | 6.5 years | 154 |
| -75 | SF8 | 5.0 years | 200 |
| -80 | SF9 | 4.0 years | 250 |
| -90 | SF10 | 2.8 years | 357 |
| -100 | SF11 | 1.8 years | 556 |
| -110 | SF12 | 1.1 years | 909 |
| -120 | SF12 + retrans | 0.6 years | 1,667 |
5. Annual Cost Model
The total annual cost of battery maintenance is made up of two components:
| Cost Component | Value Used | Formula |
| Battery (AA Lithium) | SEK 50 per sensor | Swaps/year × SEK 50 |
| Labour (technician) | SEK 420/hour, 20 min/swap | Swaps/year × (20/60) × SEK 420 |
| Labour cost per swap | SEK 140 | 20 min × SEK 420/60 min |
| Total cost per swap | SEK 190 | SEK 50 + SEK 140 |
Annual Cost Formula
| Annual Cost (SEK) = (1,000 / Battery Life in years) × (SEK 50 + (20/60 × SEK 420)) |
Cost Comparison by Signal Quality
| RSSI | Battery Life | Swaps / Year | Battery Cost | Labour Cost | Total / Year |
| -60 dBm | 6.5 yrs | 154 | SEK 7,700 | SEK 21,560 | SEK 29,260 |
| -80 dBm | 4.0 yrs | 250 | SEK 12,500 | SEK 35,000 | SEK 47,500 |
| -100 dBm | 1.8 yrs | 556 | SEK 27,800 | SEK 77,840 | SEK 105,640 |
| -120 dBm | 0.6 yrs | 1,667 | SEK 83,350 | SEK 233,380 | SEK 316,730 |
| IMPACT | Moving from RSSI -100 dBm to -60 dBm saves approximately SEK 76,000 per year across 1,000 sensors. A single additional LoRaWAN gateway costs SEK 3,000-8,000 — it pays for itself within weeks. |
6. What Can a Property Manager Do?
Improve RSSI by 10-20 dBm with low-cost actions:
- Reposition existing gateway higher (each floor gained = ~3-5 dBm improvement)
- Move gateway away from metal cabinets, lift shafts and electrical panels
- Install an outdoor or ceiling-mounted directional antenna
- Add a second LoRaWAN gateway to cover a problematic zone
- Use an antenna extension cable to reach a better mounting location
Monitor and act proactively with Sensor-online.se:
- Set RSSI alert thresholds — get notified when a sensor drops below -85 dBm
- Use the battery voltage trend to predict replacements 3-6 months in advance
- Plan batch replacements by floor or zone to minimise technician travel time
- Review gateway coverage map after any building renovation
7. Summary
| Variable | Value / Assumption |
| Sensor model | Elsys ERS Lite (indoor environment) |
| Battery type | 1× AA Lithium 3.6V, ~2,400 mAh |
| Transmission interval | Every 15 minutes (96×/day) |
| Protocol | LoRaWAN 868 MHz, ADR enabled |
| Fleet size | 1,000 sensors |
| Battery unit cost | SEK 50 per sensor |
| Swap labour time | 20 minutes per sensor |
| Technician rate | SEK 420/hour → SEK 140 per swap |
| Battery life model | Interpolated from Elsys datasheet + LoRa air-time calculator |
| RSSI range modelled | -40 dBm (excellent) to -120 dBm (critical) |
This analysis was produced using the Sensor-online.se IoT Platform. For questions about your specific installation, gateway coverage, or battery monitoring configuration, contact your Sensor-online.se account manager.