Transform IoT Sensor Data into Actionable Visual Insights
Why Data Visualization is Critical for IoT Success
Raw sensor data is just numbers. Without proper visualization, you’re flying blind. Sensor-Online™ transforms streams of data from thousands of IoT sensors into crystal-clear visual insights that drive immediate action and informed decision-making.
Whether you’re monitoring temperature sensors in a warehouse, tracking energy consumption across facilities, or analyzing water flow in irrigation systems – our powerful data visualization tools make complex data simple to understand at a glance.
Real-Time IoT Dashboard Platform with Unlimited Customization
Create Professional Dashboards Without Writing Code
Sensor-Online™ features an intuitive drag-and-drop dashboard builder that empowers anyone to create stunning visualizations:
No Programming Skills Required – Build sophisticated dashboards in minutes using our visual editor
Real-Time Data Updates – Watch your sensor data update live as events occur in the field
Responsive Design – Your dashboards look perfect on desktop, tablet, and mobile devices
Multi-User Access – Share dashboards with team members, clients, or stakeholders with custom permissions
Comprehensive Visualization Components for Every Use Case
Our platform includes a rich library of visualization widgets designed specifically for IoT data:
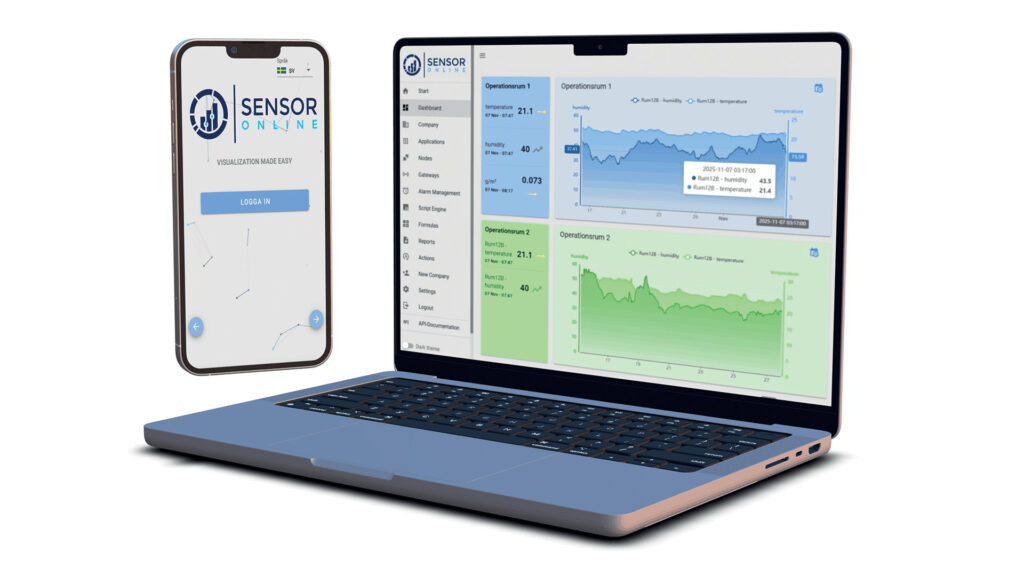
Chart Types for Time-Series Sensor Data Analysis
Line Charts for Trend Analysis
Perfect for displaying sensor data over time. Track temperature fluctuations, humidity levels, energy consumption patterns, or any time-series data. Multiple data series can be displayed simultaneously with customizable colors, scales, and legends.
Ideal for:
- Temperature monitoring over 24 hours
- Energy consumption trends
- Pressure variations in industrial systems
- Water level changes in tanks or reservoirs
Bar Charts and Column Graphs for Comparative Analysis
Compare data across different sensors, locations, or time periods. Visualize daily, weekly, or monthly aggregations to identify patterns and anomalies quickly.
Ideal for:
- Comparing energy usage across multiple buildings
- Daily production output from manufacturing lines
- Rainfall data across different weather stations
- Resource consumption by department or zone
Area Charts for Cumulative Data Visualization
Show how values accumulate over time. Perfect for total energy consumption, cumulative production volumes, or aggregated resource usage.
Ideal for:
- Total water consumption over billing periods
- Cumulative CO2 emissions tracking
- Aggregate data collection from sensor networks
- Production milestone tracking
Real-Time Gauges and Meters for Instant Status Overview
Circular Gauges for Current Values
Display live sensor readings with configurable thresholds and color-coded zones. Set warning and critical levels that change gauge colors automatically – green for normal, yellow for warning, red for critical.
Ideal for:
- Current temperature in cold storage facilities
- Real-time pressure in hydraulic systems
- Live speed monitoring in industrial equipment
- Instantaneous power consumption readings
Linear Progress Bars and Tank Level Indicators
Visualize fill levels, capacity utilization, or progress toward targets. Perfect for tanks, silos, batteries, or any container-based monitoring.
Ideal for:
- Water tank levels in remote locations
- Fuel tank monitoring in vehicles or generators
- Battery charge status in solar installations
- Silo fill levels in agriculture
Numeric Displays with Status Indicators
Large, clear numerical values with configurable formatting, units, and status lights. Show exact readings alongside visual indicators.
Ideal for:
- Precise humidity readings in greenhouses
- Exact flow rates in pipelines
- Current voltage in electrical systems
- Real-time people counting in buildings
Advanced Visualization Tools for Complex IoT Analytics
Heat Maps for Spatial Data Analysis
Visualize data density, temperature distributions, or activity patterns across geographic areas or floor plans. Perfect for understanding spatial relationships in your sensor network.
Ideal for:
- Temperature distribution in large facilities
- Occupancy patterns in smart buildings
- Network coverage quality mapping
- Soil moisture variations across farmland
Pie Charts and Donut Charts for Proportional Data
Show how total values are distributed across categories. Understand resource allocation, usage patterns, or contribution percentages at a glance.
Ideal for:
- Energy consumption by equipment type
- Production output by product line
- Alert distribution by severity level
- Resource usage by department
Scatter Plots for Correlation Analysis
Identify relationships between different sensor parameters. Discover how temperature affects humidity, or how production speed impacts quality metrics.
Ideal for:
- Temperature vs. humidity correlation analysis
- Energy efficiency optimization studies
- Quality control in manufacturing
- Environmental monitoring research
Historical Data Comparison Graphs
Overlay current data with historical periods to identify trends, seasonal patterns, or year-over-year improvements.
Ideal for:
- Comparing this year’s energy usage to last year
- Seasonal pattern identification
- Performance improvement tracking
- Baseline vs. actual analysis
Interactive Features for Deep Data Exploration
Zoom and Pan Capabilities
Dive deep into your data by zooming into specific time ranges or panning across extended periods. Analyze both micro-trends and macro-patterns seamlessly.
Customizable Time Ranges
Switch between live data, last hour, 24 hours, week, month, or custom date ranges with a single click. Time controls adapt to your analysis needs.
Data Point Tooltips and Hover Information
Hover over any data point to see exact values, timestamps, and additional contextual information. No more guessing – get precise details instantly.
Multi-Axis Support for Complex Comparisons
Display multiple parameters with different units on the same chart. Compare temperature (°C) with humidity (%) or pressure (bar) with flow rate (L/min) side by side.
Connect Data from Any Sensor Source
Visualize Data from Your Own IoT Sensors
Seamlessly display data from all sensors connected to Sensor-Online™:
- LoRaWAN Sensors – Temperature, humidity, door/window contacts, GPS trackers
- NB-IoT Devices – Smart meters, asset trackers, environmental monitors
- Cellular IoT – Vehicle telematics, remote monitoring stations
- Modbus Devices – Industrial PLCs, SCADA systems, building automation
- M-Bus Meters – Water, gas, electricity, and heat meters
Integrate External Data Sources
Combine your sensor data with external information for comprehensive analysis:
- Weather APIs – Correlate indoor climate with outdoor conditions
- Energy Price Data – Optimize consumption based on tariff rates
- Third-Party Sensors – Integrate data from partner systems via API
- Enterprise Systems – Combine IoT data with ERP, CRM, or BMS data
- Public Data Sources – Merge with open datasets for enriched analytics
API-Driven Data Integration
Use our comprehensive RESTful API to:
- Push data from custom sensors or applications
- Pull data into external business intelligence tools
- Create bidirectional data flows between systems
- Build custom integrations with legacy infrastructure
Dashboard Templates for Rapid Deployment
Pre-Built Industry Templates
Start quickly with professionally designed dashboard templates:
Smart Building Management
- HVAC performance monitoring
- Energy consumption tracking
- Occupancy and comfort metrics
- Indoor air quality dashboards
Industrial Manufacturing
- Production line monitoring
- Equipment health dashboards
- Quality control metrics
- Predictive maintenance indicators
Energy Management
- Multi-site energy comparison
- Peak demand analysis
- Cost allocation dashboards
- Renewable energy production tracking
Environmental Monitoring
- Air quality monitoring stations
- Water quality parameters
- Weather station networks
- Agricultural field monitoring
Fleet and Asset Tracking
- Vehicle location and status
- Fuel consumption analysis
- Maintenance scheduling
- Route optimization metrics
Customizable Widget Library
Access dozens of pre-configured widgets ready to use:
- Current value displays with thresholds
- Historical trend lines
- Alert status panels
- Device health indicators
- Battery level monitors
- Connection status displays
Alert Visualization and Notification Integration
Visual Alert Indicators
Never miss critical events with prominent alert displays:
- Color-Coded Status Lights – Instant status overview across your entire sensor network
- Alert Panels – Dedicated widgets showing active alarms with severity levels
- Flashing Indicators – Draw attention to urgent situations requiring immediate action
- Alert History Tables – Review past events with timestamps and resolution status
Integrated Notification System
Alerts trigger actions beyond the dashboard:
- SMS notifications to maintenance teams
- Email reports to management
- Webhook triggers to external systems
- Automated downlinks to actuators or controllers
Advanced Analytics and Data Processing
Built-In Data Aggregation Functions
Process sensor data directly in your visualizations:
- Average, Min, Max – Statistical summaries over time periods
- Sum and Total – Cumulative values for consumption or production
- Rate of Change – Delta calculations for trend analysis
- Custom Formulas – Create calculated metrics using JavaScript expressions
Data Filtering and Segmentation
Focus on what matters:
- Filter by sensor type, location, or custom tags
- Group data by time intervals (hourly, daily, weekly)
- Segment by operational status or conditions
- Create dynamic filters based on user selection
Threshold-Based Conditional Formatting
Automate visual emphasis:
- Automatic color changes when values exceed limits
- Progressive color scales for range visualization
- Icon changes based on status conditions
- Text formatting for anomaly highlighting
Multi-Tenant Dashboard Architecture
Separate Dashboards for Different Stakeholders
Create isolated dashboard environments for:
Customers – Self-service portals showing their assets only
Technicians – Detailed diagnostic views with full sensor data
Management – High-level KPI dashboards with aggregated metrics
Partners – Limited access views for collaboration
White-Label Dashboard Capabilities
Brand dashboards with your company identity:
- Custom logos and color schemes
- Company-specific terminology
- Branded login pages
- Custom domain names
Export and Reporting Capabilities
Scheduled Report Generation
Automate reporting workflows:
- Daily, weekly, or monthly PDF reports
- CSV data exports for further analysis
- Email distribution to stakeholders
- Archive historical snapshots
Data Export Formats
Get your data in the format you need:
- CSV – For Excel or data analysis tools
- JSON – For programmatic access
- PDF – For presentation and documentation
- Images – Dashboard screenshots for reports
Mobile-Responsive Dashboards
Access Your Data Anywhere
Your dashboards automatically adapt to any screen size:
- Full functionality on smartphones and tablets
- Touch-optimized controls for mobile devices
- Offline capability for intermittent connectivity
- Native-like experience in mobile browsers
Mobile Dashboard App
Optional native mobile applications for:
- Push notifications for critical alerts
- Faster loading and smoother performance
- Biometric authentication
- Optimized data usage on cellular networks
Performance Optimized for Large-Scale Deployments
Handle Thousands of Sensors Efficiently
Sensor-Online™ data visualization scales effortlessly:
- Display data from 10,000+ sensors simultaneously
- Real-time updates with minimal latency
- Intelligent data aggregation for performance
- Automatic downsampling for historical views
Smart Caching and Data Management
Optimize performance without sacrificing accuracy:
- Edge caching for frequently accessed data
- Lazy loading for on-demand data retrieval
- Progressive rendering for complex dashboards
- Background data refresh without UI blocking
Security and Access Control
Granular Permission Management
Control exactly who sees what:
- Dashboard-level access permissions
- Widget-level visibility controls
- Data filtering by user role
- Audit logs for compliance
Secure Data Transmission
Your data visualization is protected:
- End-to-end encryption (TLS/SSL)
- Secure API authentication
- Role-based access control (RBAC)
- Session management and timeout controls
Why Choose Sensor-Online™ for IoT Data Visualization?
Hardware Agnostic – Works with any sensor, any protocol, any network
No Vendor Lock-In – Export your data anytime, anywhere
Unlimited Dashboards – Create as many visualizations as you need
Real-Time Performance – See changes as they happen in the field
Professional Support – Expert assistance with dashboard design and optimization
Continuous Updates – New visualization types and features added regularly
Proven Scalability – From pilot projects to enterprise deployments
Cost-Effective – Pay only for what you use with transparent pricing
Get Started with Beautiful IoT Dashboards Today
Transform your IoT sensor data into stunning visual insights that drive better decisions and faster actions. Whether you’re monitoring a single sensor or managing thousands of devices across multiple locations, Sensor-Online™ provides the visualization tools you need to succeed.
Start visualizing your IoT data in minutes, not months.
Contact Nodeledge AB today to schedule a demo and see how our data visualization platform can transform your IoT operations. Our team will help you design custom dashboards tailored to your specific use cases and requirements.