Raw Numbers Tell You What. Sensor-Online Tells You What Matters.
Raw numbers from sensors tell you what is happening. Sensor-Online turns those numbers into context — showing you what matters, when it matters, without requiring a data analyst to interpret the output. Every measurement arriving in Sensor-Online is processed, stored and made actionable in real time.
From Sensor to Insight: The Processing Chain
Here is how a raw sensor value becomes a usable insight in Sensor-Online:
- Sensor transmits — raw bytes over LoRaWAN, NB-IoT, Modbus or MQTT
- Decoder interprets — the device type library converts bytes to labelled values with correct units
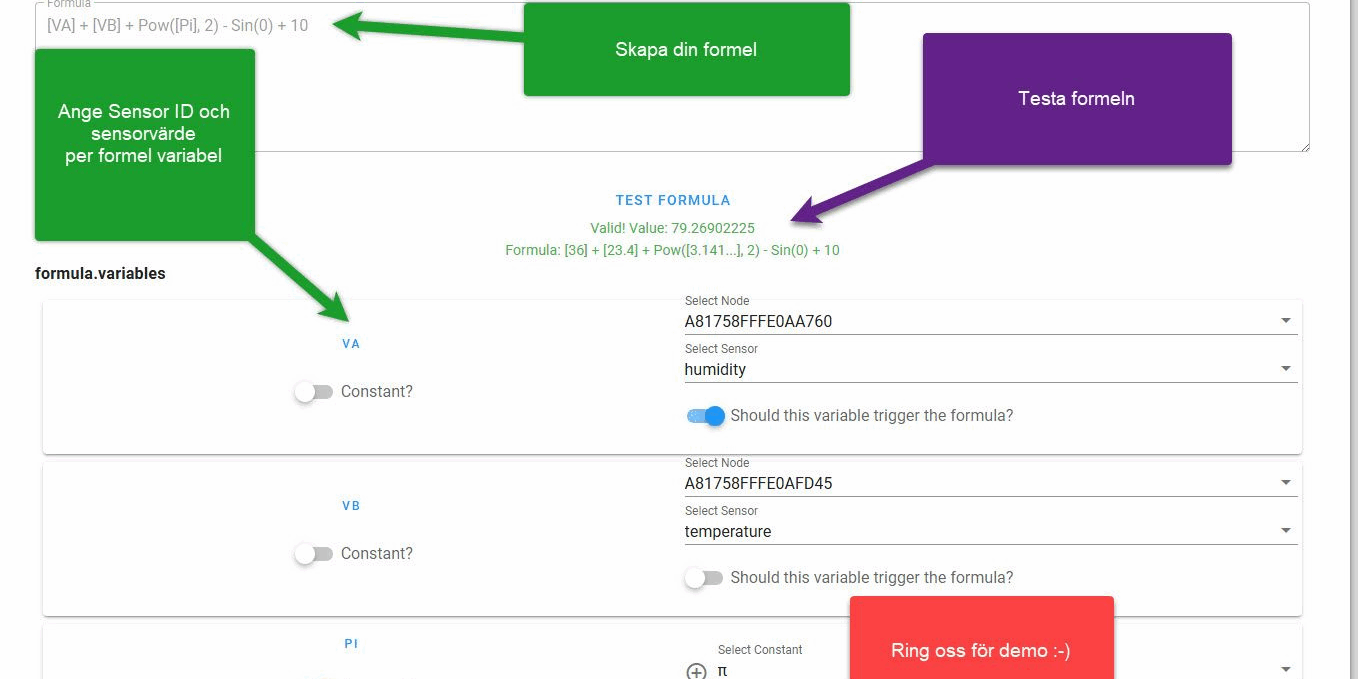
- JavaScript engine processes — custom calculations, unit conversions and KPI logic run in real time
- Data is stored — in Sensor-Online’s time-series database with full timestamp and device metadata
- Dashboard, alarms and reports activate — visualisation, threshold logic and scheduled reporting operate on the stored value
What Insights Look Like in Practice
Thresholds trigger alerts automatically. Trends are visualised without export. KPIs are calculated on the fly using the built-in JavaScript engine. You do not need to export data to a separate BI tool to understand what is going on.
Examples of insights from live sensor data in Sensor-Online:
- Energy cost in real time — electricity consumption (kWh) multiplied by the current Nordpool spot price, displayed as a live cost-per-hour widget
- Heating efficiency — room temperature compared against outdoor temperature (from SMHI or a local weather station) to automatically flag rooms that are over-heated relative to the setpoint
- Pump station status — well level, pump runtime and flow rate combined into a single operational status indicator with alarm escalation
- Indoor air quality score — CO₂, temperature and humidity combined into a single IAQ index per room
No Exports, No Analysts, No Waiting
Traditional monitoring setups require exporting data to Excel, running queries or waiting for a monthly report. In Sensor-Online, the insight is available the moment the data arrives — on a live dashboard accessible from any browser or mobile device. For organisations managing multiple buildings, sites or assets, this means the right person sees the right information at the right time, automatically.
Sharing Insights Outside the Platform
Insights generated in Sensor-Online can be shared outside the platform through several channels:
- Scheduled email reports with charts and summary tables
- REST API access for BI tools (Power BI, Grafana, Tableau)
- MQTT publish for SCADA and historian integration
- Webhook-based alerts to Slack, Teams or custom endpoints
FAQ: Real-Time Insights in Sensor-Online
How quickly does Sensor-Online process and display incoming sensor data?
Typically within a few seconds of the sensor transmitting. LoRaWAN uplinks from sensor to dashboard display take 2–5 seconds under normal network conditions.
Can I build custom KPIs without writing code?
Simple KPIs (min, max, average, sum over a period) are configured through the no-code interface. Complex calculations — such as energy cost based on variable pricing — use the JavaScript engine, which requires basic scripting knowledge.
Can non-technical staff access and understand the dashboards?
Yes. Dashboards in Sensor-Online are designed for operational staff, not IT teams. Widgets are self-explanatory and can include plain-language labels, colour coding and target values to make the current status immediately clear to anyone viewing the screen.
Explore Sensor-Online’s data processing capabilities or visit the knowledge base for configuration guides.